Structural MRI Infering IQ
Deep Learning on Brain MRI to Infer IQ Scores
Can brain structure predict human intelligence? T1-weighted structural brain magnetic resonance images (sMRI) have been correlated with intelligence. Nevertheless, population-level association does not fully account for individual variability in intelligence. To address this, individual prediction studies emerge recently. However, they are mostly on predicting fluid intelligence (the ability to solve new problems). Studies are lacking to predict crystallized intelligence (the ability to accumulate knowledge) or general intelligence (fluid and crystallized intelligence combined). This study tests whether deep learning of sMRI can predict an individual subject’s verbal, comprehensive, and full-scale intelligence quotients (VIQ, PIQ, FSIQ), which reflect both fluid and crystallized intelligence. We performed a comprehensive set of 432 experiments, using different input images, six deep learning models, and two outcome settings, on 850 autistic and healthy subjects 6-64 years of age. Results show promise with statistical significance and also open up questions inviting further future studies.

Brief Description of the Method
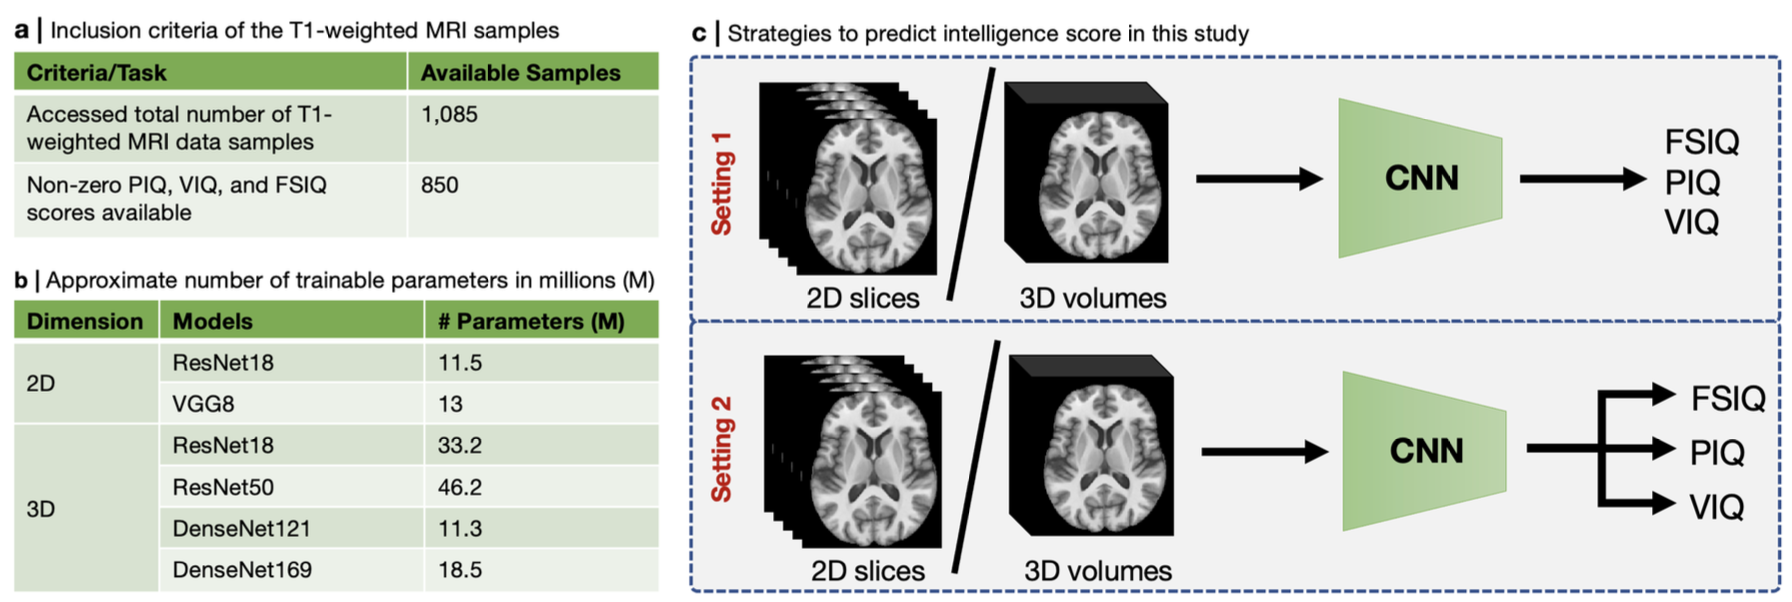
We trained two 2D and four 3D deep CNNs (listed in Fig. 1(b)) using T1-weighted MRI volumes (N = 850) in two settings. In the first setting, we used intensity (i.e., contrast channel) and RAVENS (regional analysis of volumes examined in normalized space; i.e., morphometry channel) images to predict three IQ scores separately (i.e., FSIQ or PIQ, or VIQ). On the other hand, we used intensity and RAVENS maps to predict three IQ scores simultaneously (i.e., FSIQ and PIQ, and VIQ) in the second setting (see Fig. 1(c)). For 2D CNNs, we chose a different number of axial slices (n = [5, 10, 20, 40, 70, 100, 130]) as channels. Since our 3D volume has 130 axial slices, we selected slices as [65 − ⌊n/2⌋, 65 + ⌊n/2⌋]. Intensity (denoted as I) and RAVENS (denoted as R) maps were used as inputs to both 2D and 3D CNNs separately and together as channels (denoted as IR). We used 5-fold cross-validation for each experiment, and each fold was scheduled to run for 30 and 100 epochs for 2D and 3D CNNs, respectively. We ran a total of 432 experiments, which involve training deep CNN training in each case. We picked the best validation performance in each fold.
Data
We accessed 1,085 T1-weighted MRI scans from Autism Brain Imaging Data Exchange (ABIDE I)37 and included 850 scans in this study due to the availability of the non-zero PIQ, VIQ, and FSIQ scores (see Fig. 1(a)). Subjects’ ages range from 6-64 years (mean 16.79±7.28 years). The numbers of men and women were 725 (85%) and 125 (15%), respectively. Furthermore, 417 (49%) were autistic patients and the rest (51%) were healthy controls among these subjects. These data are collected in 15 North American and European sites. The ground truth FSIQ, PIQ, and VIQ scores also came with the sMRI data.
Results

Absolute and Residual IQ Prediction by 2D CNNs: We ran 336 experiments using 2D CNNs for seven different slice numbers, three types of input, and two output settings. We presented individual experiment-wise IQ score prediction performance in terms of Pearson correlation (r) and mean absolute error in Supplementary Fig. 1 and Tables 1–8, where we observe that statistically significant (p < 0.001) PIQ, VIQ, and FSIQ prediction performance are achieved by 2D-ResNet18 for contrast input (i.e., I) and absolute IQ scores in setting 1. Nonetheless, we present an overall absolute and residual IQ prediction performance in terms of r for different slice numbers and input types in Fig. 2(a, b) and (c, d), respectively. We see in Fig. 2(a, b) that the mean r between the ground truth and predicted absolute and residual PIQ, VIQ, and FSIQ tends to get overall better for higher slice numbers (i.e., 70, 100, and 130). Furthermore, we see in Fig. 2(c, d) that the mean r between the ground truth and predicted absolute and residual PIQ, VIQ, and FSIQ is the overall best for contrast input (i.e., I).

Absolute and Residual IQ Prediction by 3D CNNs: We also performed 96 experiments using 3D CNNs for three types of input and two output settings. We presented individual experiment-wise IQ score prediction performance in terms of Pearson correlation (r) and mean absolute error in Supplementary Fig. 2 and Tables 9–24, where we observe that better r with statistically significant (p < 0.001) for PIQ, VIQ, and FSIQ scores is achieved by 3D-ResNet18 for contrast input (i.e., I). We also present an overall absolute and residual IQ prediction performance by 3D CNNs in terms of r for different input types in Fig. 3(a). The figure shows that the mean r between the ground truth and the predicted absolute PIQ, VIQ, and FSIQ is the best overall for the input of morphometry (i.e., R). Furthermore, we see in Fig. 3(a) that the mean r between the ground truth and predicted residual PIQ, VIQ, and FSIQ is the overall best for the contrast input (i.e., I).
Comparative IQ Prediction Performance by 2D and 3D CNNs: We present comparative PIQ, VIQ, and FSIQ prediction performance in terms of Pearson correlation (r) in Fig. 3(b), (c), and (d), respectively, by different 2D and 3D CNNs. In Fig. 3(b), we see that the overall best PIQ prediction is achieved by 2D and 3D CNNs for the morphometry (i.e., R), followed by the contrast (i.e., I) and contrast-morphometry combined (i.e., IR) inputs. Furthermore, we see in Fig. 3(c) that overall best VIQ prediction is achieved by 2D and 3D CNNs for the contrast (i.e., I), followed by the morphometry (i.e., R) and the contrast-morphometry combined (i.e., IR) inputs. Similarly, we see in Fig. 3(d) that the overall best FSIQ prediction is achieved by 2D and 3D CNNs for the contrast (i.e., I), followed by the morphometry (i.e., R) and the contrast-morphometry combined (i.e., IR) inputs.
For Details
Please read our paper for details [1]. Also, see the supplementary materials here. Codes can be found here.