Kidney Assessment with Deep Learning
Segmentation-free Kidney Volume Estimation
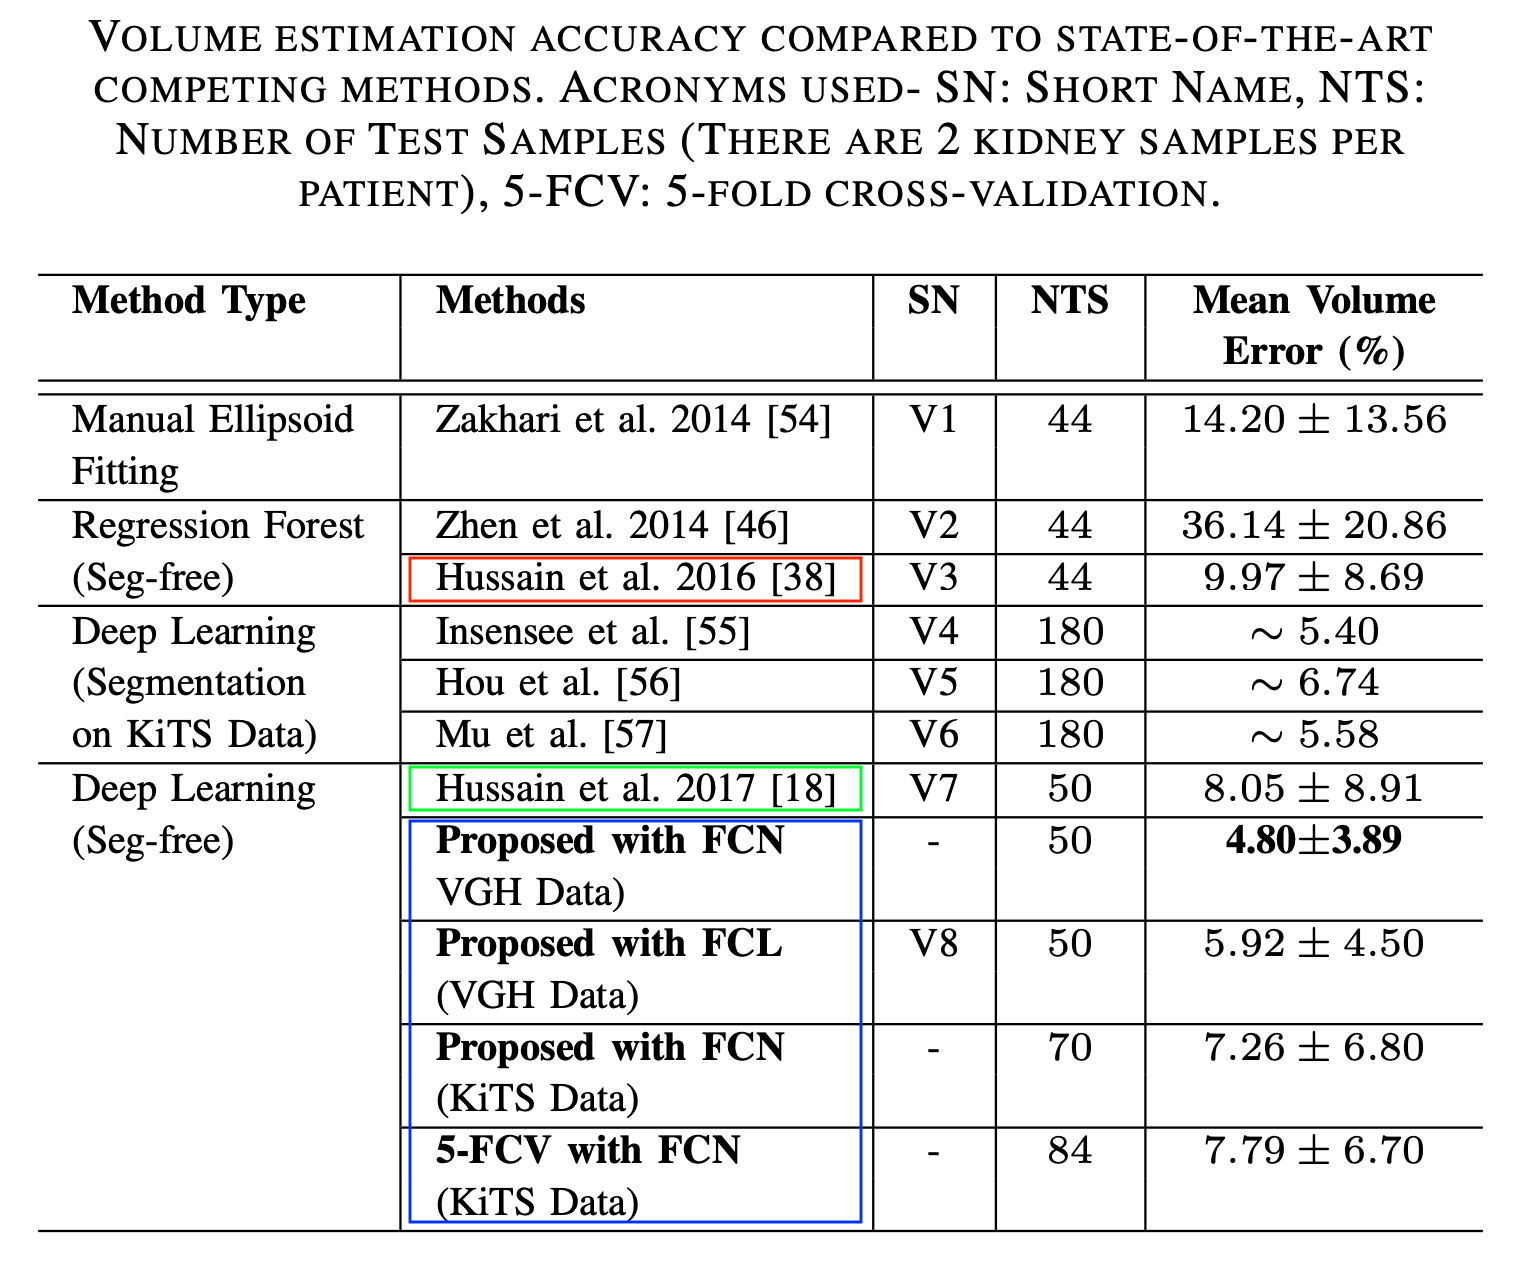
The economic burden of chronic kidney disease (CKD) is significant, estimated in Canada in 2007 at $1.9 Billion just for patients with end-stage renal disease (ESRD). In 2011, about 620,000 patients in United States received treatment for ESRD either by receiving dialysis or by receiving kidney transplantation. ESRD is the final stage of different CKDs, e.g., Autosomal dominant polycystic kidney disease (ADPKD), renal artery atherosclerosis (RAS), which are associated with the change of kidney volume. However, detection of CKDs are complicated; multiple tests such as the estimated glomerular filtration rate (eGFR) and serum albumin-to-creatinine ratio may not detect early disease and may be poor at tracking progression of disease. Recent works have suggested kidney volume as the potential surrogate marker for renal function and is thus useful for predicting and tracking the progression of different CKDs. In fact, the total kidney volume has become the gold-standard image biomarker for the ADPKD and RAS progression at early stages of this disease. In addition, the renal volumetry has recently emerged as the most suitable alternative to renal scintigraphy in evaluating the split renal function in kidney donors as well as the best biomarker in follow-up evaluation of kidney transplants. Consequently, estimation of the ‘volume’ of a kidney has become the primary objective in various clinical analyses of kidney. Traditionally, the kidney volume is estimated by means of segmentation. However, existing kidney segmentation algorithms have various limitations (e.g., requiring user interaction, sensitivity to parameter setting, heavy computation). In our intitial study, we develop dual regression forests to simultaneously predict the kidney area per image slice, and kidney span per image volume. However, in that study, we used hand-engineered features, whch are often not optimal. Therefore, in our subsequent work, we further improved the segmentation-free volume estimation performance by incorporating deep CNN that skips the segmentation procedure. To the best of our knowledge, our segmentation-free method is the first that uses deep CNN for kidney volume estimation. We estimate slice-based cross-sectional kidney areas followed by integration over these values across axial kidney span to produce the volume estimate. We also shoed that FCN performs better than a CNN of equivalent number of parameters in regression-based organ area estimation.
Segmentation-Free Estimation of Kidney Volumes using Deep Learning

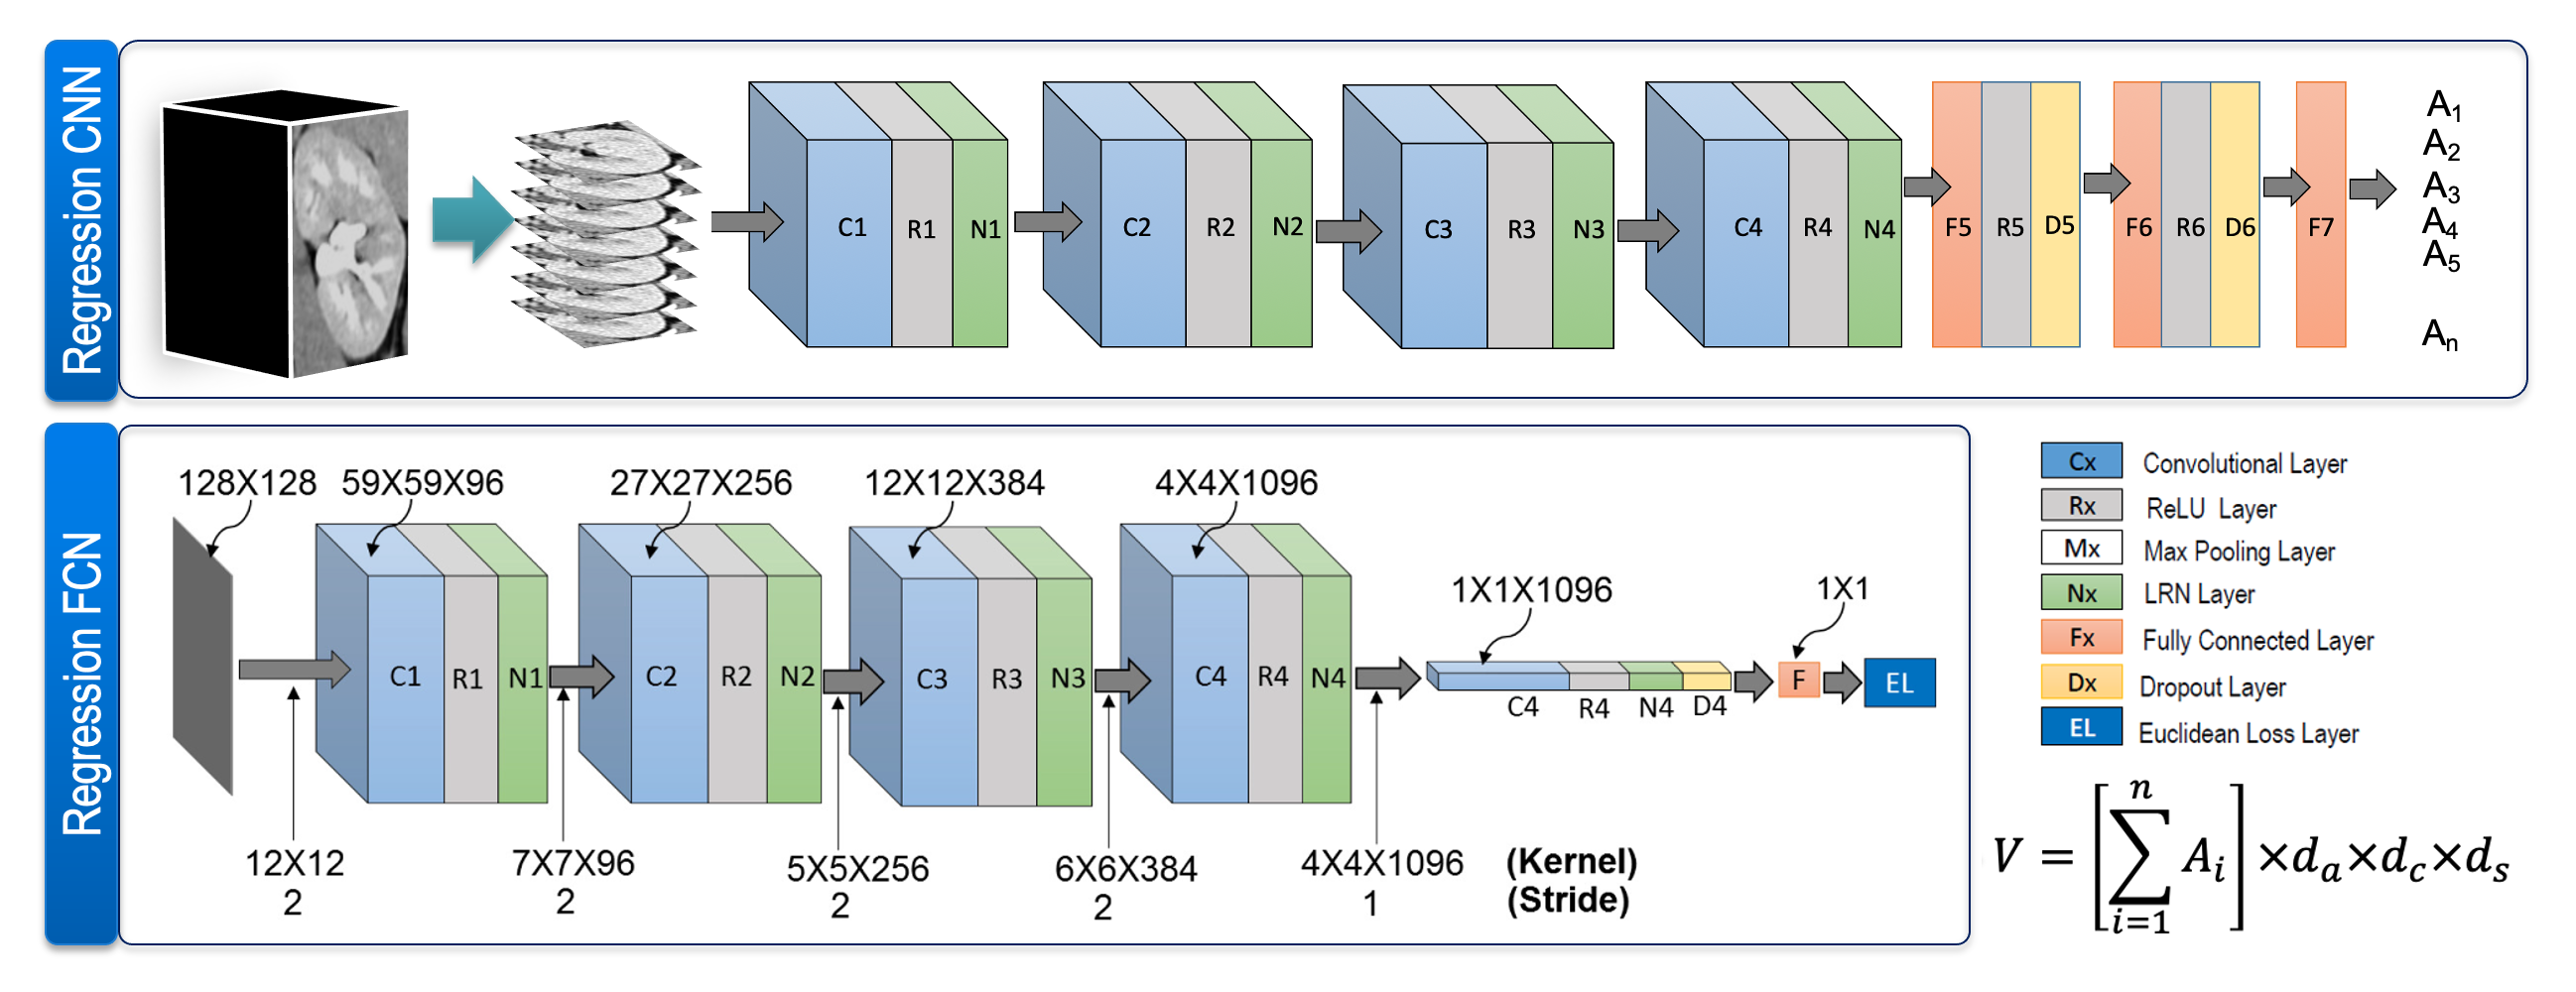
CNN-based Approach: We estimate the cross-sectional area of a kidney in each slice using a deep CNN shown in Fig. 1 (top). The CNN performs regression and has seven layers excluding the input. It has four convolutional layers, three fully connected layers, and one Euclidean loss layer. We also use dropout layers along with the first two fully connected layers in order to avoid over-fitting. As mentioned earlier, the input is a 120×120 pixel image patch and the output is the ratio of kidney pixels to the total image size. The CNN is trained by minimizing the Euclidean loss between the desired and predicted values. Once the CNN model is trained, we deploy the model to predict the kidney area in a particular image patch. Finally, the volume of a particular kidney is estimated by integrating the predicted areas in all of its image patches in the axial direction.
FCN-based Approach: We use an FCN (Fig. 1, bottom) to predict the crosssectional area of a kidney in each patch. Our FCN is a regression network consisting of six layers, excluding the input. It has five convolutional layers, one fully connected layer (only to generate a single activation), and one Euclidean loss layer. To avoid overfitting, we use the dropout in the last convolution layer. During inference, the FCN predicts the kidney area in a particular image patch. Finally, we calculate a particular kidney’s volume by adding the FCN-predicted areas for all of its axial image patches and multiplying by the voxel dimensions.
Data
We used 100 patients’ CT scans accessed from the Vancouver General Hospital (VGH) records with required ethics approvals by the UBC Clinical Research Ethics Board (CREB), certificate number: H15-00237. There were a total of 200 kidney samples, and we used 130 samples (from 65 randomly chosen patients) for training, 20 samples (from 10 randomly chosen patients) for validation, and the remaining 50 samples for testing. Our dataset included 12 pathological kidney samples (with endo- and exophytic tumors), and our training and test data contained six pathological cases each. We made sure that kidneys from the same patient were not split across the training, validation, and test cases. These data were acquired using a Siemens SOMATOM Definition Flash (Siemens Healthcare GmbH, Erlangen, Germany) CT scanner. Ground truth kidney bounding boxes were calculated from manual kidney delineation performed by an expert radiologist.
We also used 210 patients’ CT scans from the 2019 Kidney Tumor Segmentation (KiTS) Challenge database. This database contains patients’ scans accessed from the University of Minnesota Medical Center records. These patients underwent partial or radical nephrectomy for one or more kidney tumors between 2010 and 2018. We used 160 randomly chosen patients’ data for training, 15 randomly chosen patients’ data for validation, and the remaining 35 patients data (70 kidney samples) for testing. Here also, we made sure that kidneys from the same patient were not split into the training, validation, and test cases. We also collected the kidney segmentation data from the same database.
Results

For Details